 |
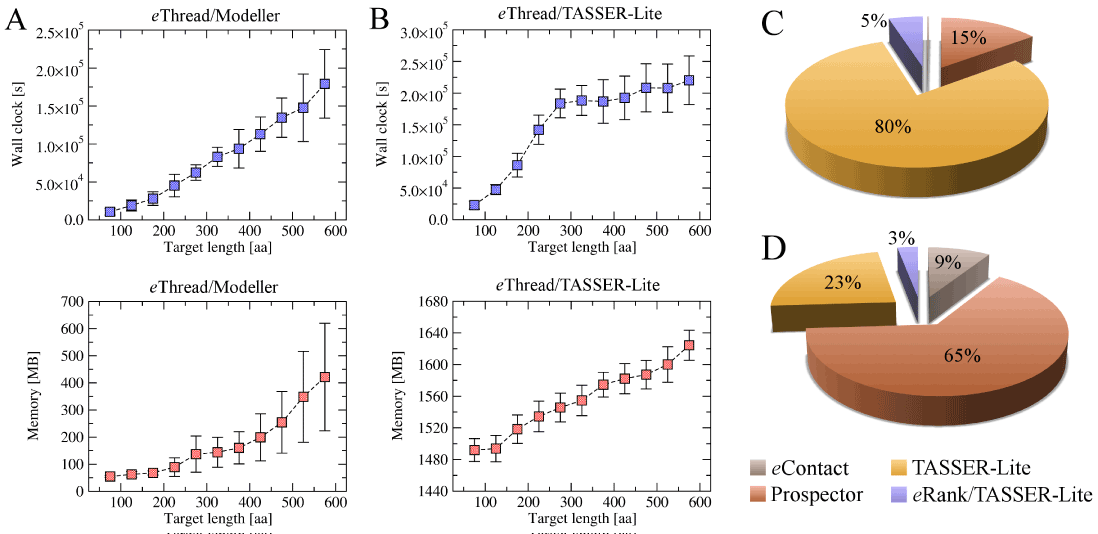
| Figure 6: Resource profiling for protein structure modeling. Average ± standard deviation wall time and memory consumption for the model construction using (A) eThread/Modeller and (B) eThread/TASSER-Lite plotted as a function of the target protein length. Percentage of (C) wall time and (D) memory used bythe individual components of the eThread/TASSER-Lite modeling protocol: eContact, Prospector, TASSER-Lite and eRank/TASSER-Lite. |