|
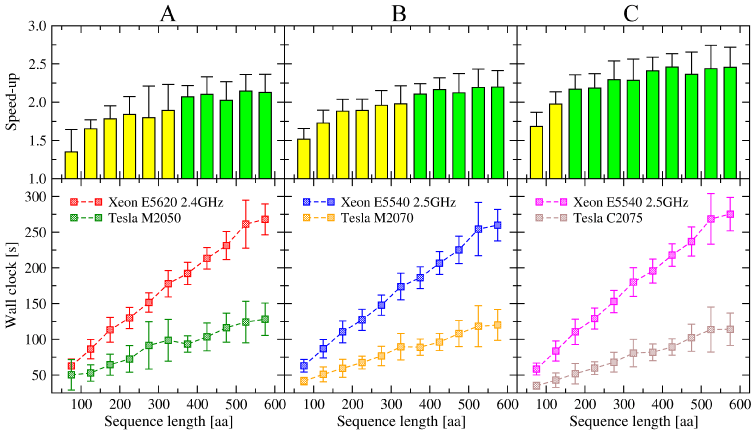
| Figure 7: Wall clock time and speedups of parallel GPU-BLASTp relative to serial NCBI BLASTp. Performance is evaluated on three testing systems: (A) Xeon 2.4GHz/ M2050, (B) Xeon 2.5GHz/M2070, and (C) Xeon 2.4GHz/C2075. For each sequence length bin, the average value with the corresponding standard deviation is plotted. In the top pane, speedups below and over 2 are colored in yellow and green, respectively. |