 |
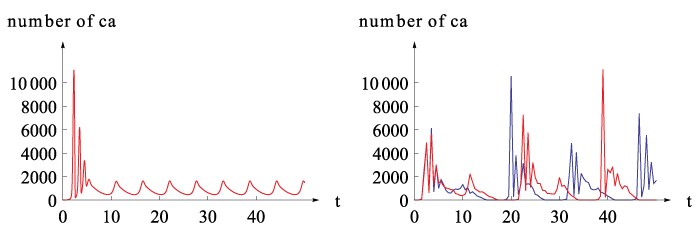
| Figure 1: ODE and stochastic simulation of the Calcium oscillation model. The graphics on the left side shows an ODE simulation of the Calcium oscillation model. The graphics on the right side shows two stochastic realizations of the Calcium oscillation system. Parameters and initial values as given in the results section. |