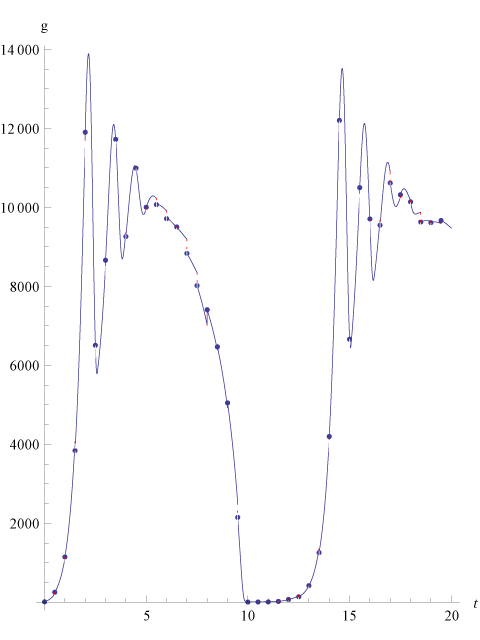
Figure 5: Representation of partially observed Calcium oscillation
system’s dynamics, g. The blue points are the data points. Blue curves are
the ODE dynamics for each time interval [ti-1,ti] namely  with
the estimated parameter. Red dotted lines show the residuals. 100 observation
from from partially observed Calcium oscillation model (g) with T=50 and
v0=(10,10,10) for the estimation of with
the estimated parameter. Red dotted lines show the residuals. 100 observation
from from partially observed Calcium oscillation model (g) with T=50 and
v0=(10,10,10) for the estimation of  using (2) with K={0}. Dynamics shown
until T=20. using (2) with K={0}. Dynamics shown
until T=20. |