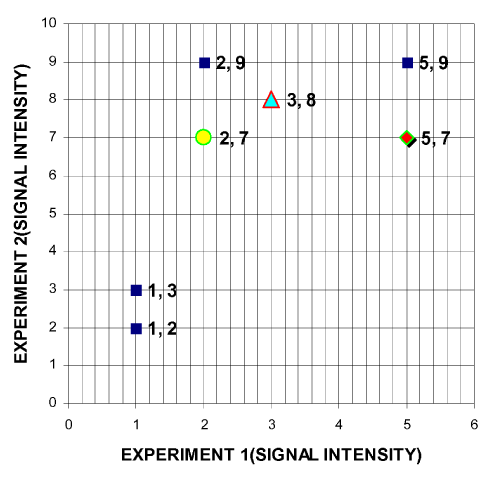
Figure 3: Iteration 0 graph with designated centroids.
The centroids 1-3 are now designated on the scattered graph with red, blue and yellow data points, respectively.