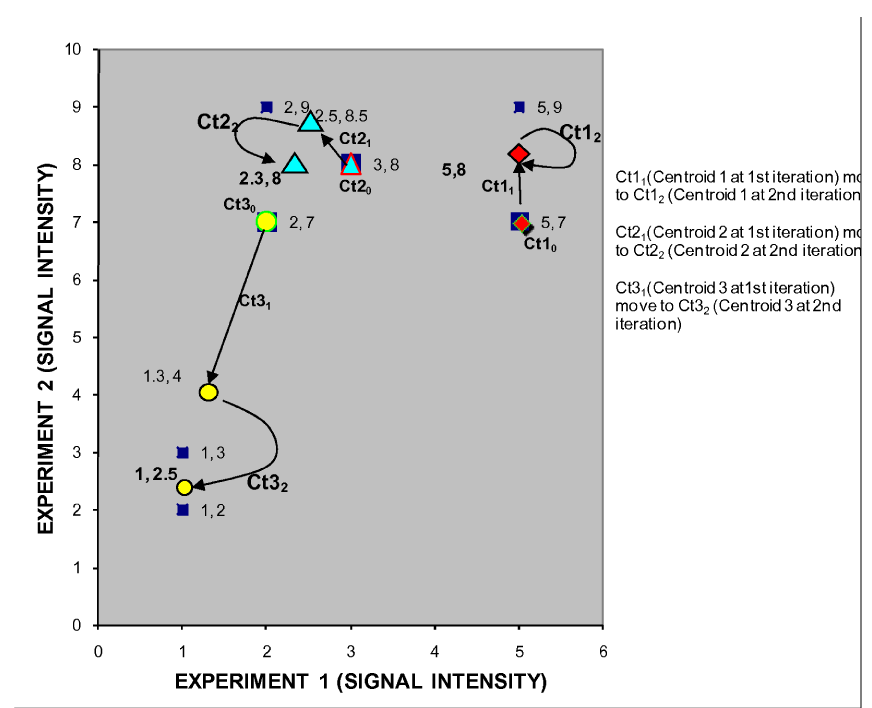
Ct11 (Centroid 1 at 1st iteration) move to Ct12 (Centroid 1 at 2nd iteration)
Ct21 (Centroid 2 at 1st iteration) move to Ct22 (Centroid 2 at 2nd iteration)
Ct31 (Centroid 3 at 1st iteration) move to Ct32 (Centroid 3 at 2nd iteration)
 |
| Figure 5: K-mean iteration 2 plot showing centroid movement. Ct11 (Centroid 1 at 1st iteration) move to Ct12 (Centroid 1 at 2nd iteration) Ct21 (Centroid 2 at 1st iteration) move to Ct22 (Centroid 2 at 2nd iteration) Ct31 (Centroid 3 at 1st iteration) move to Ct32 (Centroid 3 at 2nd iteration) |