 |
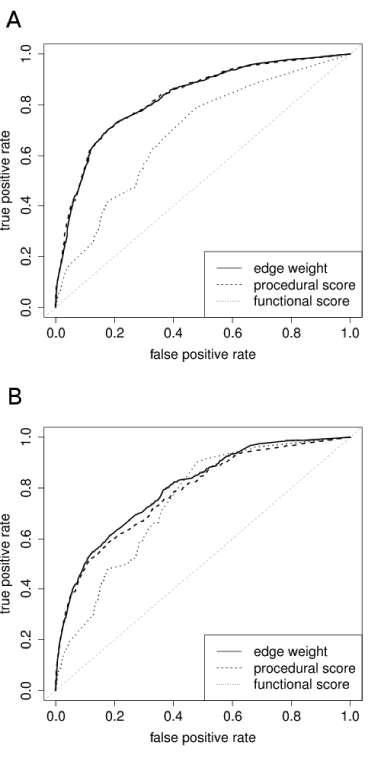
| Figure 6: Receiver operator characteristic (ROC) curve for the entire set of INT1 (A) and for MI:0407 direct interactions only (B). For each weight cutoff in [0,1] the true positive rate (percentage of INT1 correctly identified from total INT1) is plotted against the false positive rate (percentage of computed interactions falsely assigned as interactions with respect to the experimental reference). ROC curves are plotted for the entire set of interactions, as well as separately for the interaction classes “procedural” (resting on annotation from GO process, Reactome and PANTHER pathway membership) and “functional” (resting on annotation from protein domain and GO molecular function). |