 |
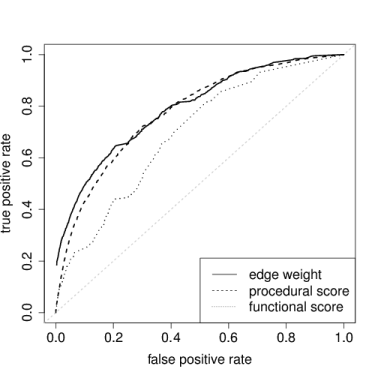
| Figure 7: Receiver operator characteristic (ROC) curve for classifying KEGG interactions. For each weight cutoff in [0,1] the true positive rate (percentage of KEGG edges correctly assigned as interaction on the basis of the computed interaction) is plotted against the false positive rate (percentage of edges not represented in KEGG but predicted as being present). ROC curves are plotted for the entire set of interactions, as well as separately for the interaction classes “procedural” (resting on annotation from GO process, Reactome and PANTHER pathway membership) and “functional” (resting on annotation from protein domain and GO molecular function). |