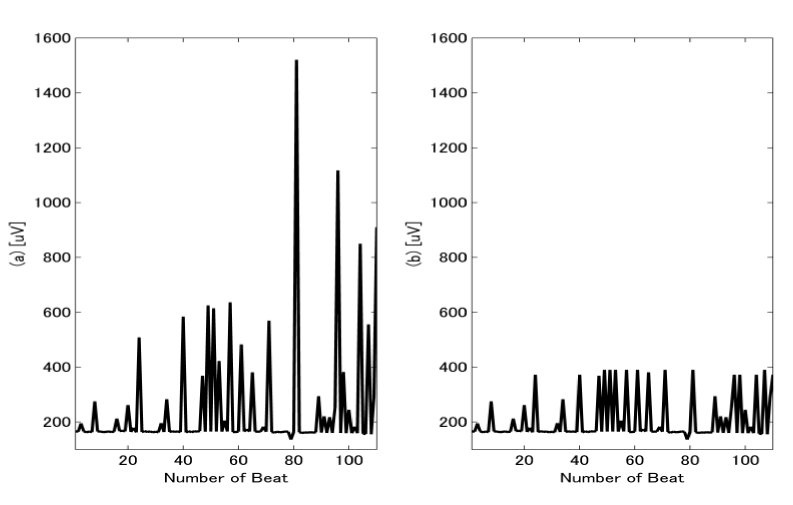
Figure 5:
An example to show the correction of outlier beats using the robust statistics-like method. Left: original series of T-wave amplitudes. Right: the processed series.