 |
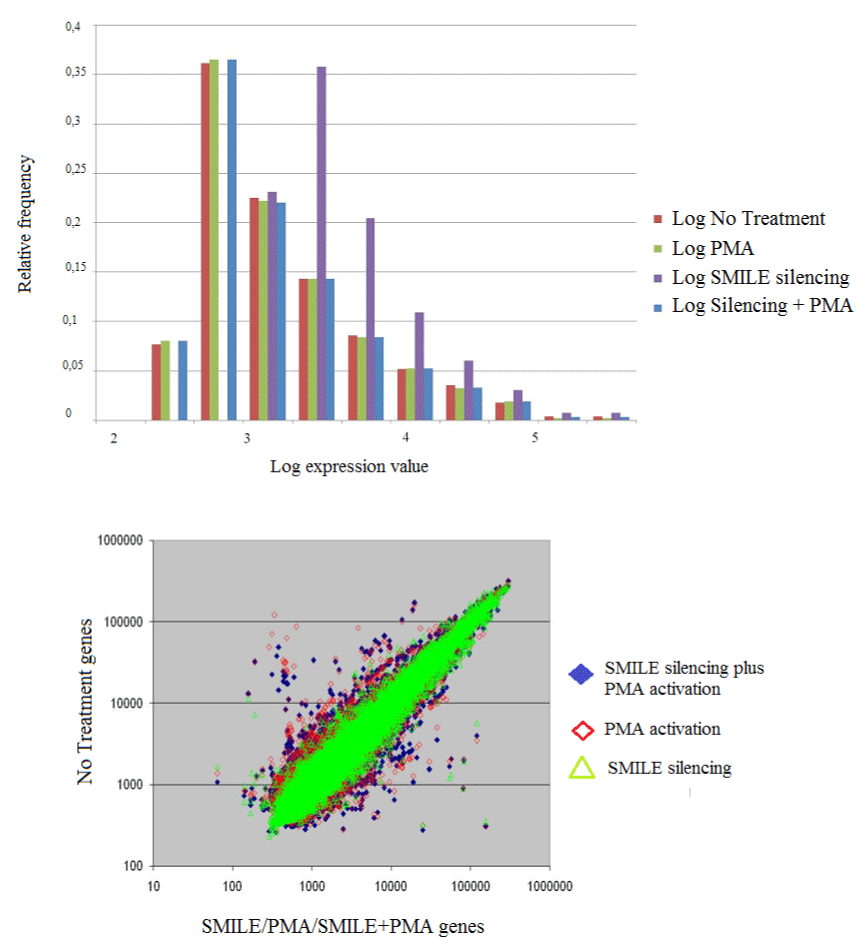
| Figure 5: LOWESS normalized and log-transformed gene expression values for the SMILE knock-down experiment: no treatment group, PMA activation group, SMILE silencing group and SMILE knock-down plus PMA activation group (up) and scatter plot of PMA activation, SMILE silencing and SMILE knock-down plus PMA activation genes versus no treatment genes (bottom). |