|
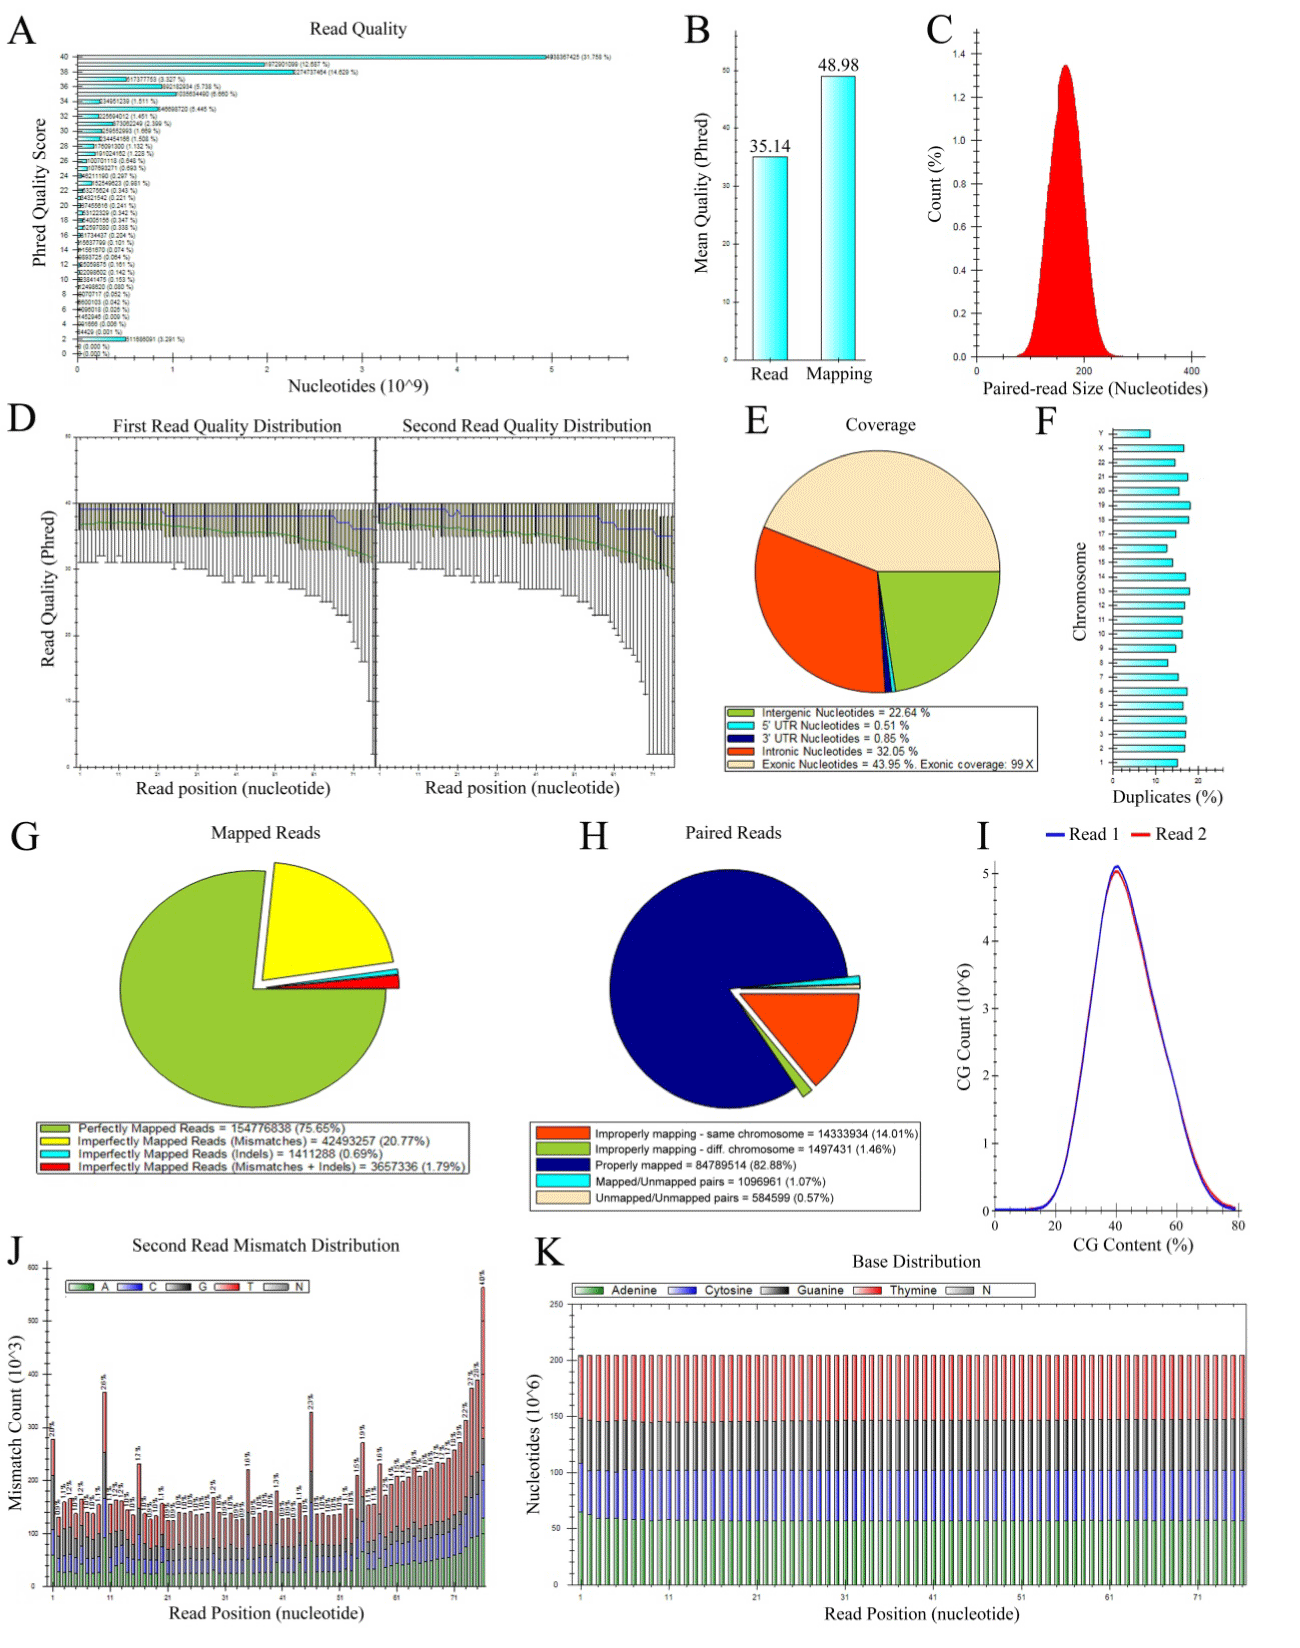
| Figure 1: Selection of SAM-Profiler output panels. A) Read quality distribution. B) Overall mapping and read quality. C) Pair-end fragment distribution. D) Read quality distribution across the two reads of a pair-end experiment: mean, median, P10, 25, 75 and 90 are showed for first and second read. E) Coverage distribution across exonic, intronic and intergenic regions and in 3’/5’UTR. Fold-Coverage for exonic regions is also reported. F) Pie chart showing the distribution of perfectly and imperfectly mapped reads. Imperfectly mapped reads are further analyzed in order to report the cause of the suboptimal mapping. G) Pie chart showing the relative mapping of paired reads. Counts and percentage of Properly, Improperly, Mapped/Unmapped and Unmapped/Unmapped pairs are shown. Improperly mapped pairs are further analyzed in order to report improperly mapping occurring in the same or in different chromosomes. H) Bar chart of the per-chromosome duplicates analysis. Here only the per-sequence/per-position duplicate panel is shown. I) Bar graph reporting the per-read and per-base mismatch distribution, with individual reports for each of the four bases plus N. Here only the mismatch distribution for the second read is shown. J) Bar chart showing the overall base distribution across the reads. |