 |
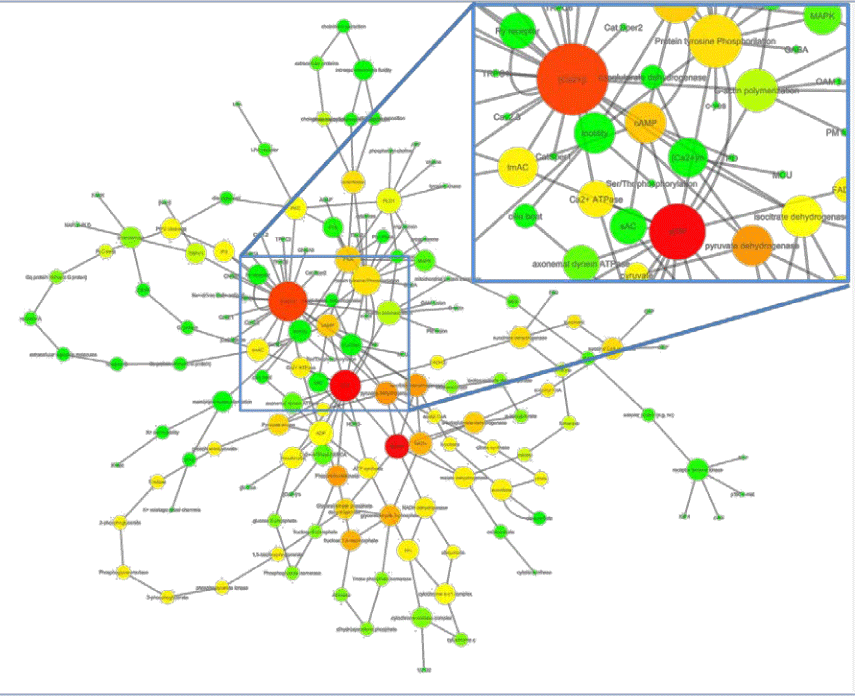
| Figure 4: Biological network representing the molecular events occurring during human sperm capacitation. The node size is proportional to the connection number and the node color gradient, from red (higher values) to green (lower values), is dependent from the closeness centrality. This parameter is computed as: Cc(n) = 1/avg(L(n,m)), were L (n,m) is the length of the shortest path between two nodes n and m. The closeness centrality of each node ranges from 0 (green) to 1 (red) and it is a measure of how fast the information spreads from a given node to the other nodes. The spatial network arrangement was obtained by using the Cytoscape Spring-embedded Layout. In zoom panel are shown the most connected nodes ([Ca2+]i and ATP. |