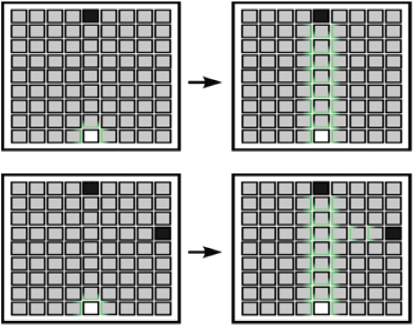
Figure 1:
Represents the 2D square grid of tissues where the white square represents the auxin molecule, black squares represents the auxin source and the green squares represents the Pin localization showing the path of auxin transport [3].