 |
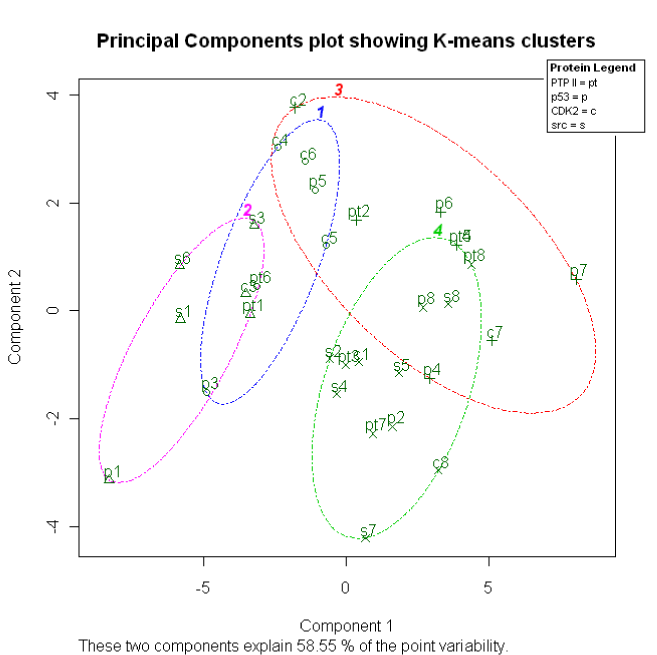
| Figure 6: Clustering solution for a specimen of 32 protein samples of raw data. Only binning preprocessing function was performed before cluster analysis run. On the bottom of the red cluster (cluster 3) Master Mix spectra (“mm”) and Noise spectra (“noise”) are shown in the same point. |