 |
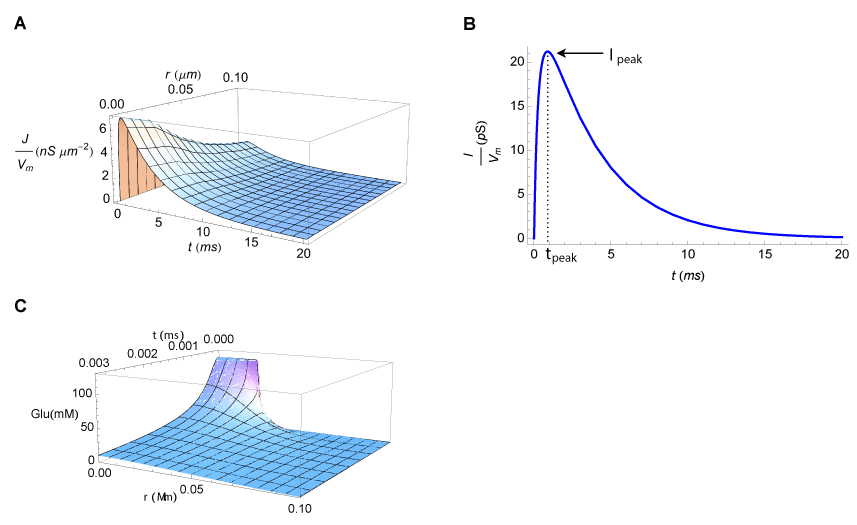
| Figure 3: Current density, current, and glutamate time evolution for a particular configuration of AMPA receptors. (A) Changes in current density as a function of time and radius of the PSD. (B) Changes in current as a function of time for rPSD=102 nm and number of AMPA receptors=100. (C) Changes in the glutamate concentration as a function of time and radius of the PSD. |