 |
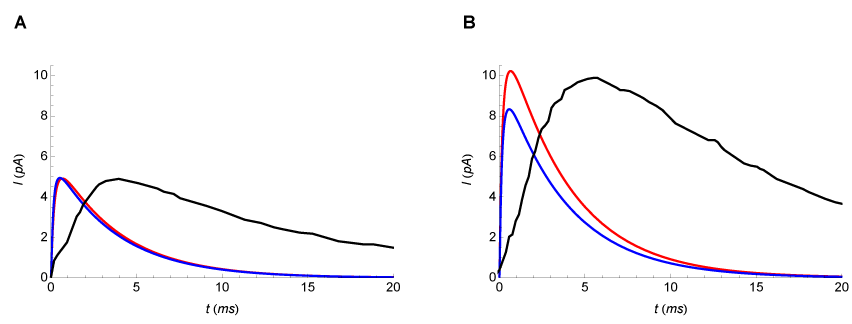
| Figure 9: Comparison of current response between the free dif- fusion model and the receptor-imited diffusion model. The free diffusion model (N=28, rPSD=102 nm, blue curve) and the receptor-limited diffusion model (N=40, rPSD=102 nm, red curve) are compared with experimental data (black curve, extracted from ref. [30]) after one and two release events. (A) One release event, NGlu=3000. (B) Two release events. NGlu=6000. See text for details about the temporal discrepancy. |