 |
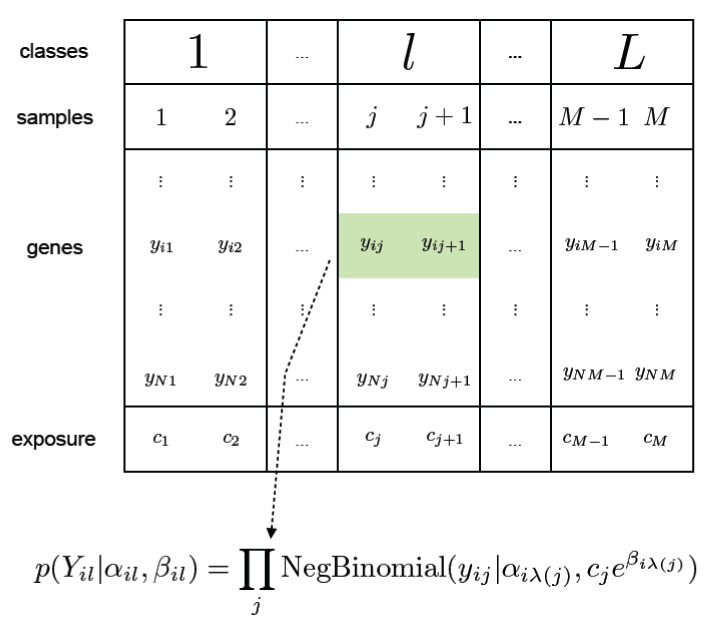
| Figure 1: Format of digital gene expression data. Rows correspond to genes and columns correspond to samples. Samples are grouped into classes (e.g. tissues or experimental conditions). Each element of the data matrix is a whole number indicating the number of counts or reads corresponding to the ith gene at the jth sample. The sum of the reads across all genes in a sample is the depth or exposure of that sample. |