 |
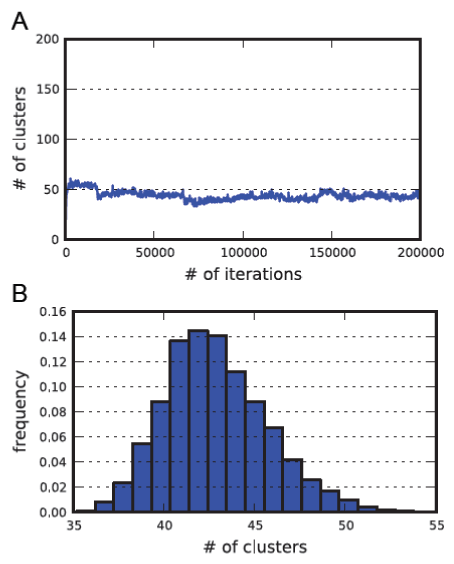
| Figure 6: Stochastic evolution of the number of clusters during 200K iterations of the simulation (panel A) and the resulting histogram after discarding the first 75K iterations as burn-in (panel B). After reaching equilibrium, the number of clusters fluctuates around a mean of approximately 43 clusters. In general, the estimated number of clusters is much smaller than the truncation level (K = 200, see y-axis in panel A). The histogram in panel B approximates the posterior distribution of the number of clusters given the data matrix Y. |