 |
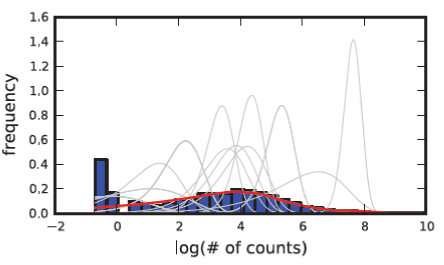
| Figure 8: Histogram of the log of the number of reads from sample GliNS1, a subset of the estimated clusters (gray lines) and the estimated model of the sample at the end of the simulation. Each cluster (gray line) represents a Negative Binomial distribution with specific α and β parameters, which models a subset of the count data in this particular sample. The complete model (red line) is the weighted sum of all component clusters. |