 |
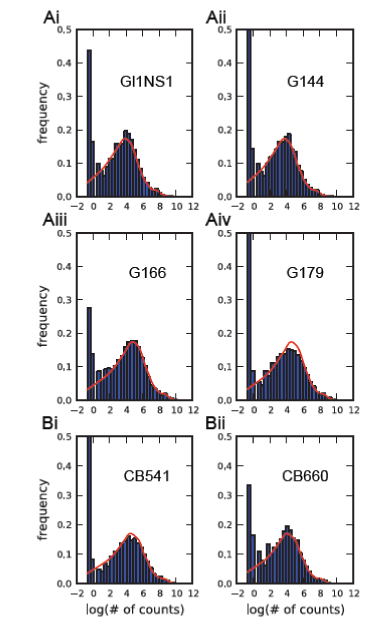
| Figure 9: Histograms of the log of the number of reads from cancerous (panels Ai-iv) and non-cancerous (panels Bi,ii) samples and the respective estimated models after 200K iterations of the algorithm. As already mentioned, each red line is the weighted sum of many component Negative Binomial distributions / clusters, which model different subsets of each data sample. We may observe that the estimated models fit tightly the corresponding data samples. |