|
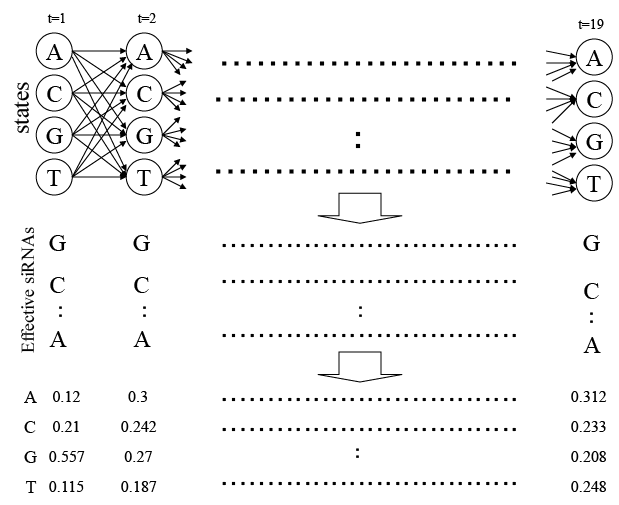
| Figure 1: State diagram of hidden Markov model. A set of 833 effective siRNA sequences from the literature is shown in the middle part of the Figure 1, and the frequency ratios of individual nucleotides at each position in those sequences are shown in the bottom of Figure 1. The ratios of the nucleotides A, C, G, and T at position 2, for example, are respectively 250/833 (=0.3), 202/833 (=0.242), 225/833 (=0.27), and 156/833 (=0.187). |