 |
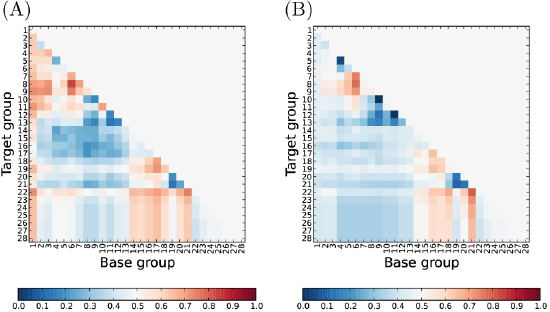
| Figure 3: Two heat maps of areas under the ROC curve of 378 (= 28 C2) conservation score sets using variabilities based upon (A) a substitution matrix and sequence weights and (B) information entropy. The AUC of the conservation score set of 36 different residues between the human eEF1A1 and eEF1A2 sequences was calculated by using the N331S and M335Q residues, which are equivalent to the N329 and K333 residues involving actin binding of the yeast eEF1A molecule [13], as learning data. The positive direction of the learning data defined as ascending order of the 13 conservation scores. |