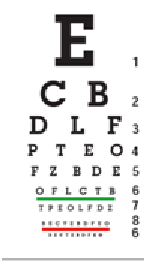
Figure 4:
Snellen chart for testing Visual Acuity.