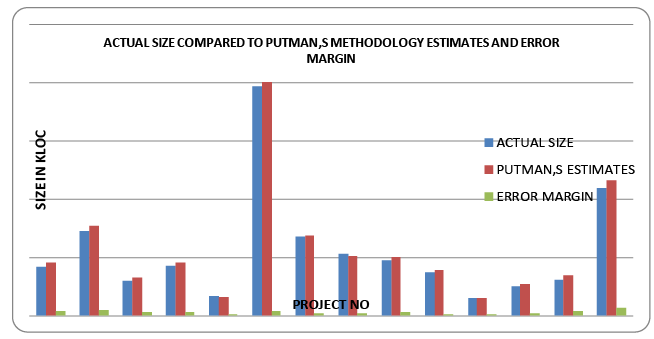
Figure 3:
Bar chart showing comparison of actual size, estimates by pairwise methodology and error margin.