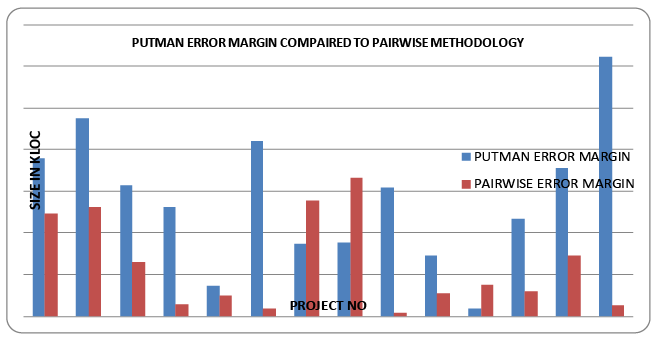
Figure 4:
Bar chart comparing error margins generated by the two methods.