 |
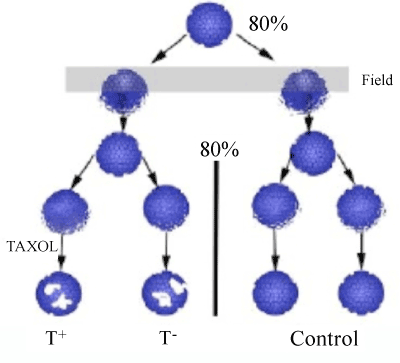
| Figure 3: Protocol for HL-60 experiment. The experiment intends to confirm the non-local signaling identified anecdotally and also illustrates the top-down approach. T+ represent the Taxol (apoptosis) treated group. T- (treated with vehicle ) represents the cells theoretically entangled to the T+ group. Control represents vehicle treated cells not correlated with either T+ or T- cells. Arrows represent cell splits (angular) or growth (vertical) while the gray area is low frequency high intensity EMF exposure. |