 |
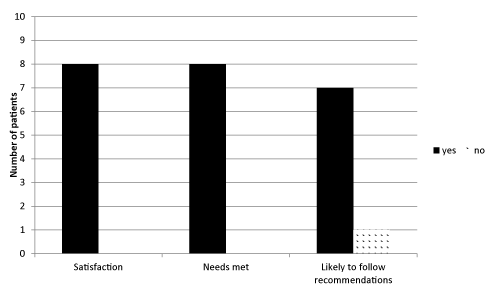
| Figure 4: Patient Survey Results Regarding the Use of the Morbidly Obese Choice Model This graph arranges the result of the patient survey into a visual format. The graph denotes patient satisfaction with the program, whether the program met patient needs, and whether the patient is likely to follow the recommendations by either yes or no responses. |