 |
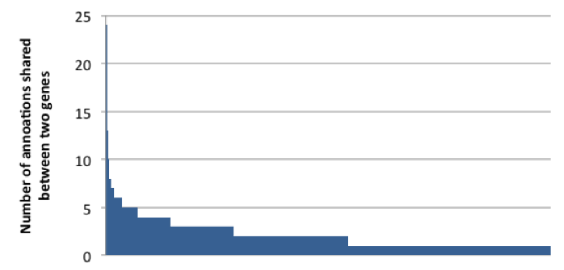
| Figure 2: Distribution of number of annotations: The figure shows the distribution of the number of annotations shared between two correlated genes. There are 15,827 gene pairs among the correlated genes and the x-axis shows gene pair number sorted on number of annotations shared between a pair of gene (from highest to lowest). The y-axis shows the number of annotations shared between two genes. Most number of annotations shared between two genes is 24 and least number of annotations is 1 (which means they only share correlation in expression profiles, but no other annotation). |