|
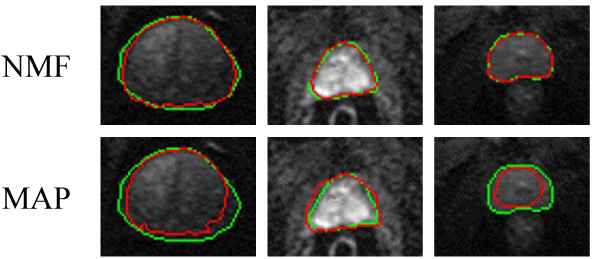
| Figure 7:Comparative segmentation results projected into 2D for visualization of the 3D segmentation for 3 different patients using the (a) proposed approach and (b) the maximum a posteriori (MAP) guided level-set where the green and red curves correspond to the ground truth and the segmentations, respectively. |