 |
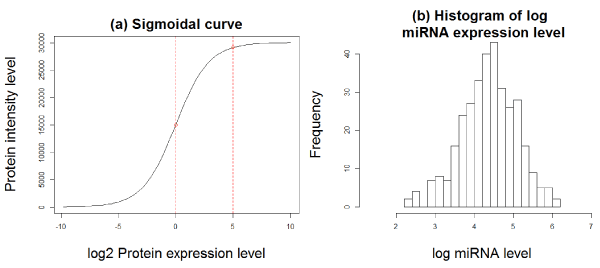
| Figure 2: An illustration of (a) a sigmoidal shape response curve. When α1 was set to be 0, the center of the EC50s would located at 0; When α1 was set to be 5, the center of EC50s would located at 5; (b) distribution of a typical miRNA expression in the TCGA data we used in the simulation. |