 |
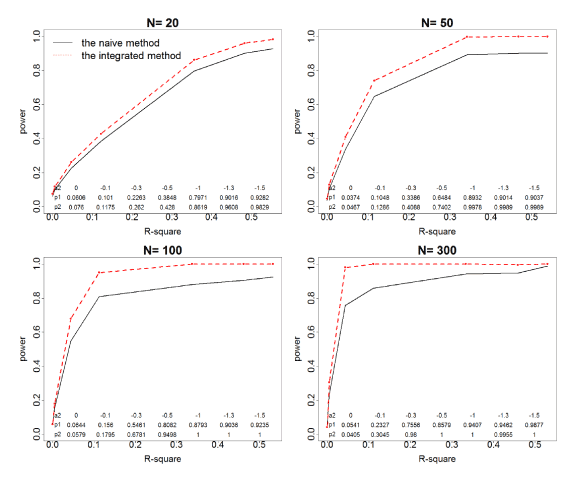
| Figure 4: Power curves of the naïve model (solid line) and the integrated model (dashed line) according different simulation scenarios: sample size ranged from 20 to 300 and the protein intensities were located in the upper part of a sigmoidal curve. Detection powers (type I error if α2=0) denoted by p1 and p2 under different correlation strength were report on the bottom of each figure for the naïve and integrated models, respectively. Both models can well control the pre-specified type-I error when sample size were bigger than 50. The integrated model was consistently more powerful than the naïve model. |