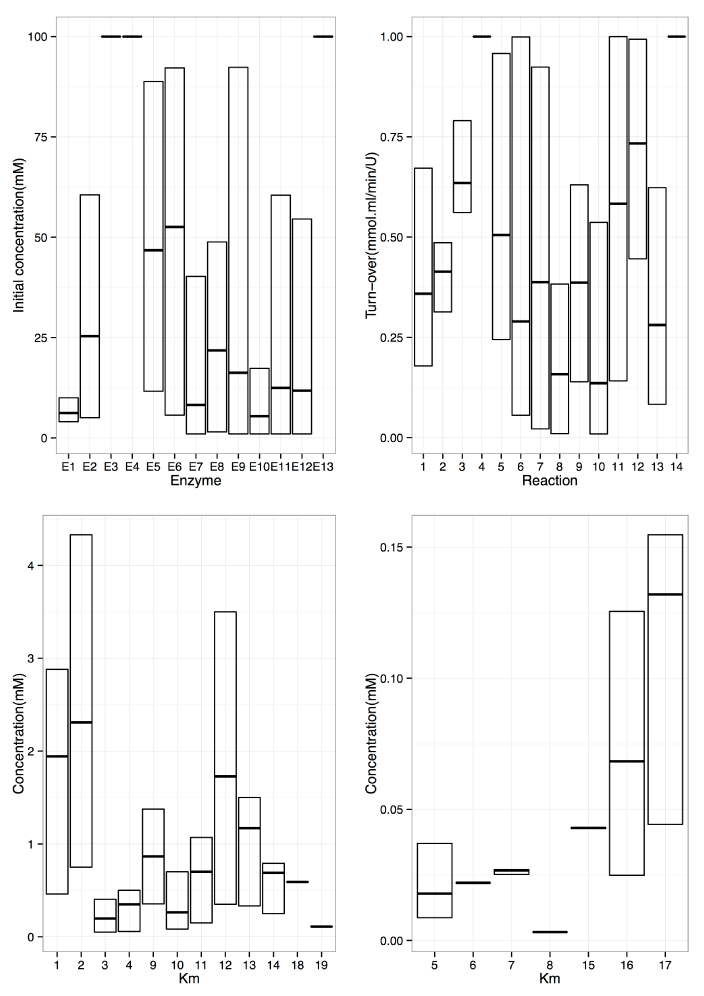
Under these conditions, near-optimal H2 production was obtained. Horizontal bars indicate average values. Top left shows results after optimization of E0 for all 13 enzymes; cellobiosephosphorylase (E1), phosphoglucomutase (E2),glucose-6-phosphate dehydrogenase (E3), 6-phosphogluconic dehydrogenase (E4), ribose 5-phosphate isomerase (E5),ribulose-5- phosphate 3-epimerase (E6), transketolase (E7), transaldolase (E8), triosephosphate isomerase (E9), aldolase (E10), fructose-1,6-bisphosphatase (E11), phosphoglucoseIsomerase (E12), NADP+dependent hydrogen dehydrogenase (E13). Top right shows results after optimization of kcat for all 14 reactions (see Method and Supplementary Table 1 for detailed description of the reactions); Bottom are the results after optimization of Km for all 19 substrates (1:KmPi of reaction r1; 2:KmCb of r1; 2:KmCb of r2; 3:KmG1P of r2; 4:KmG6P of r2; 5:KmG6P of r3; 6:KmNADP of r3; 7:Km6PG of r4; 8:KmNADP of r4; 9:KmRu5P of r5; 10:KmRu5P of r6; 11:KmDHAP of r9; 12:Kmg3P of r9; 13:KmDHAP of r10; 14:Kmg3P of r10; 15:KmFdP of r11; 16:KmF6P of r12; 17:KmG6P of r12; 18:KmNADP of r13; 19:KmNADPH of r13).