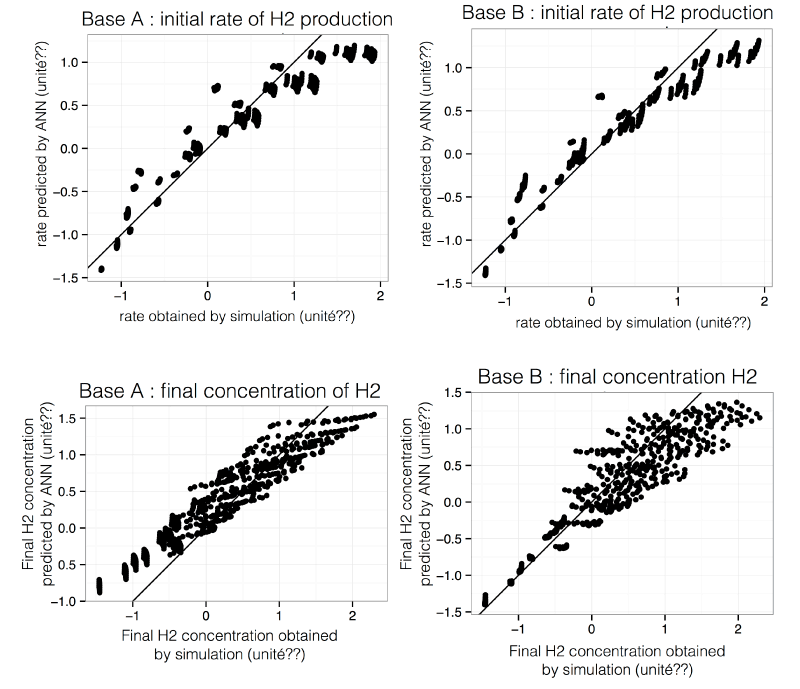
The models were built on input/output vectors from 32 simulations (BaseA) and 12 simulations (BaseB). Straight line on each graph represents bisector. Values on x and y axis are normalized values for both rate of H2 production and final H2 concentration.