 |
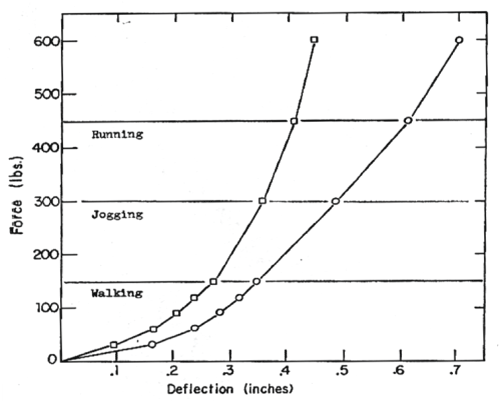
| Figure 3: Force-deflection graph for the ball (forefoot) region (squares) and the heel region (circles) of a running shoe. Typical load levels for walking, jogging, and running are shown, indicating that the effective stiffness does vary with the applied force level. |