 |
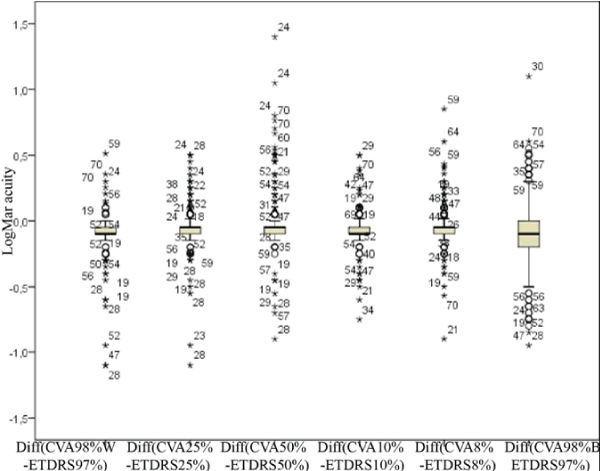
| Figure 3: Box and whisker pl ot of the difference in logMAR acuity between each CVA module and the ETDRS chart (scored by total letter count) presenting the same Michelson Contrast. The plot depicts the median, 25%, and 75% quartiles; the whiskers represent 95% confidence limits. The outliers are marked with asterisks for those beyond 1.5× the box length and with stars for those beyond 3.0× box length. Each of the outliers is presented with the patient’s age. |