 |
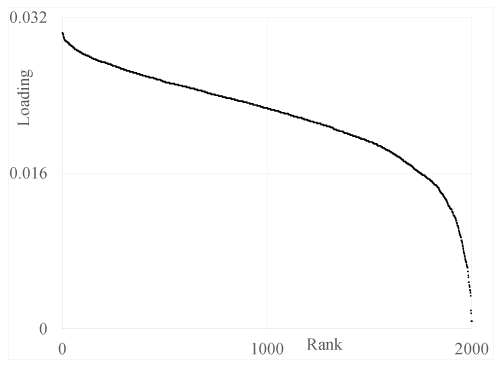
| Figure 3: An example of loadings for a PCA plotted against their magnitude which is proportional to their contribution. The loadings are for the selected PC for the MM in the Colon Cancer case. The highest ranks are on the left and the rank decreases as the value on the x-axis increase. |