 |
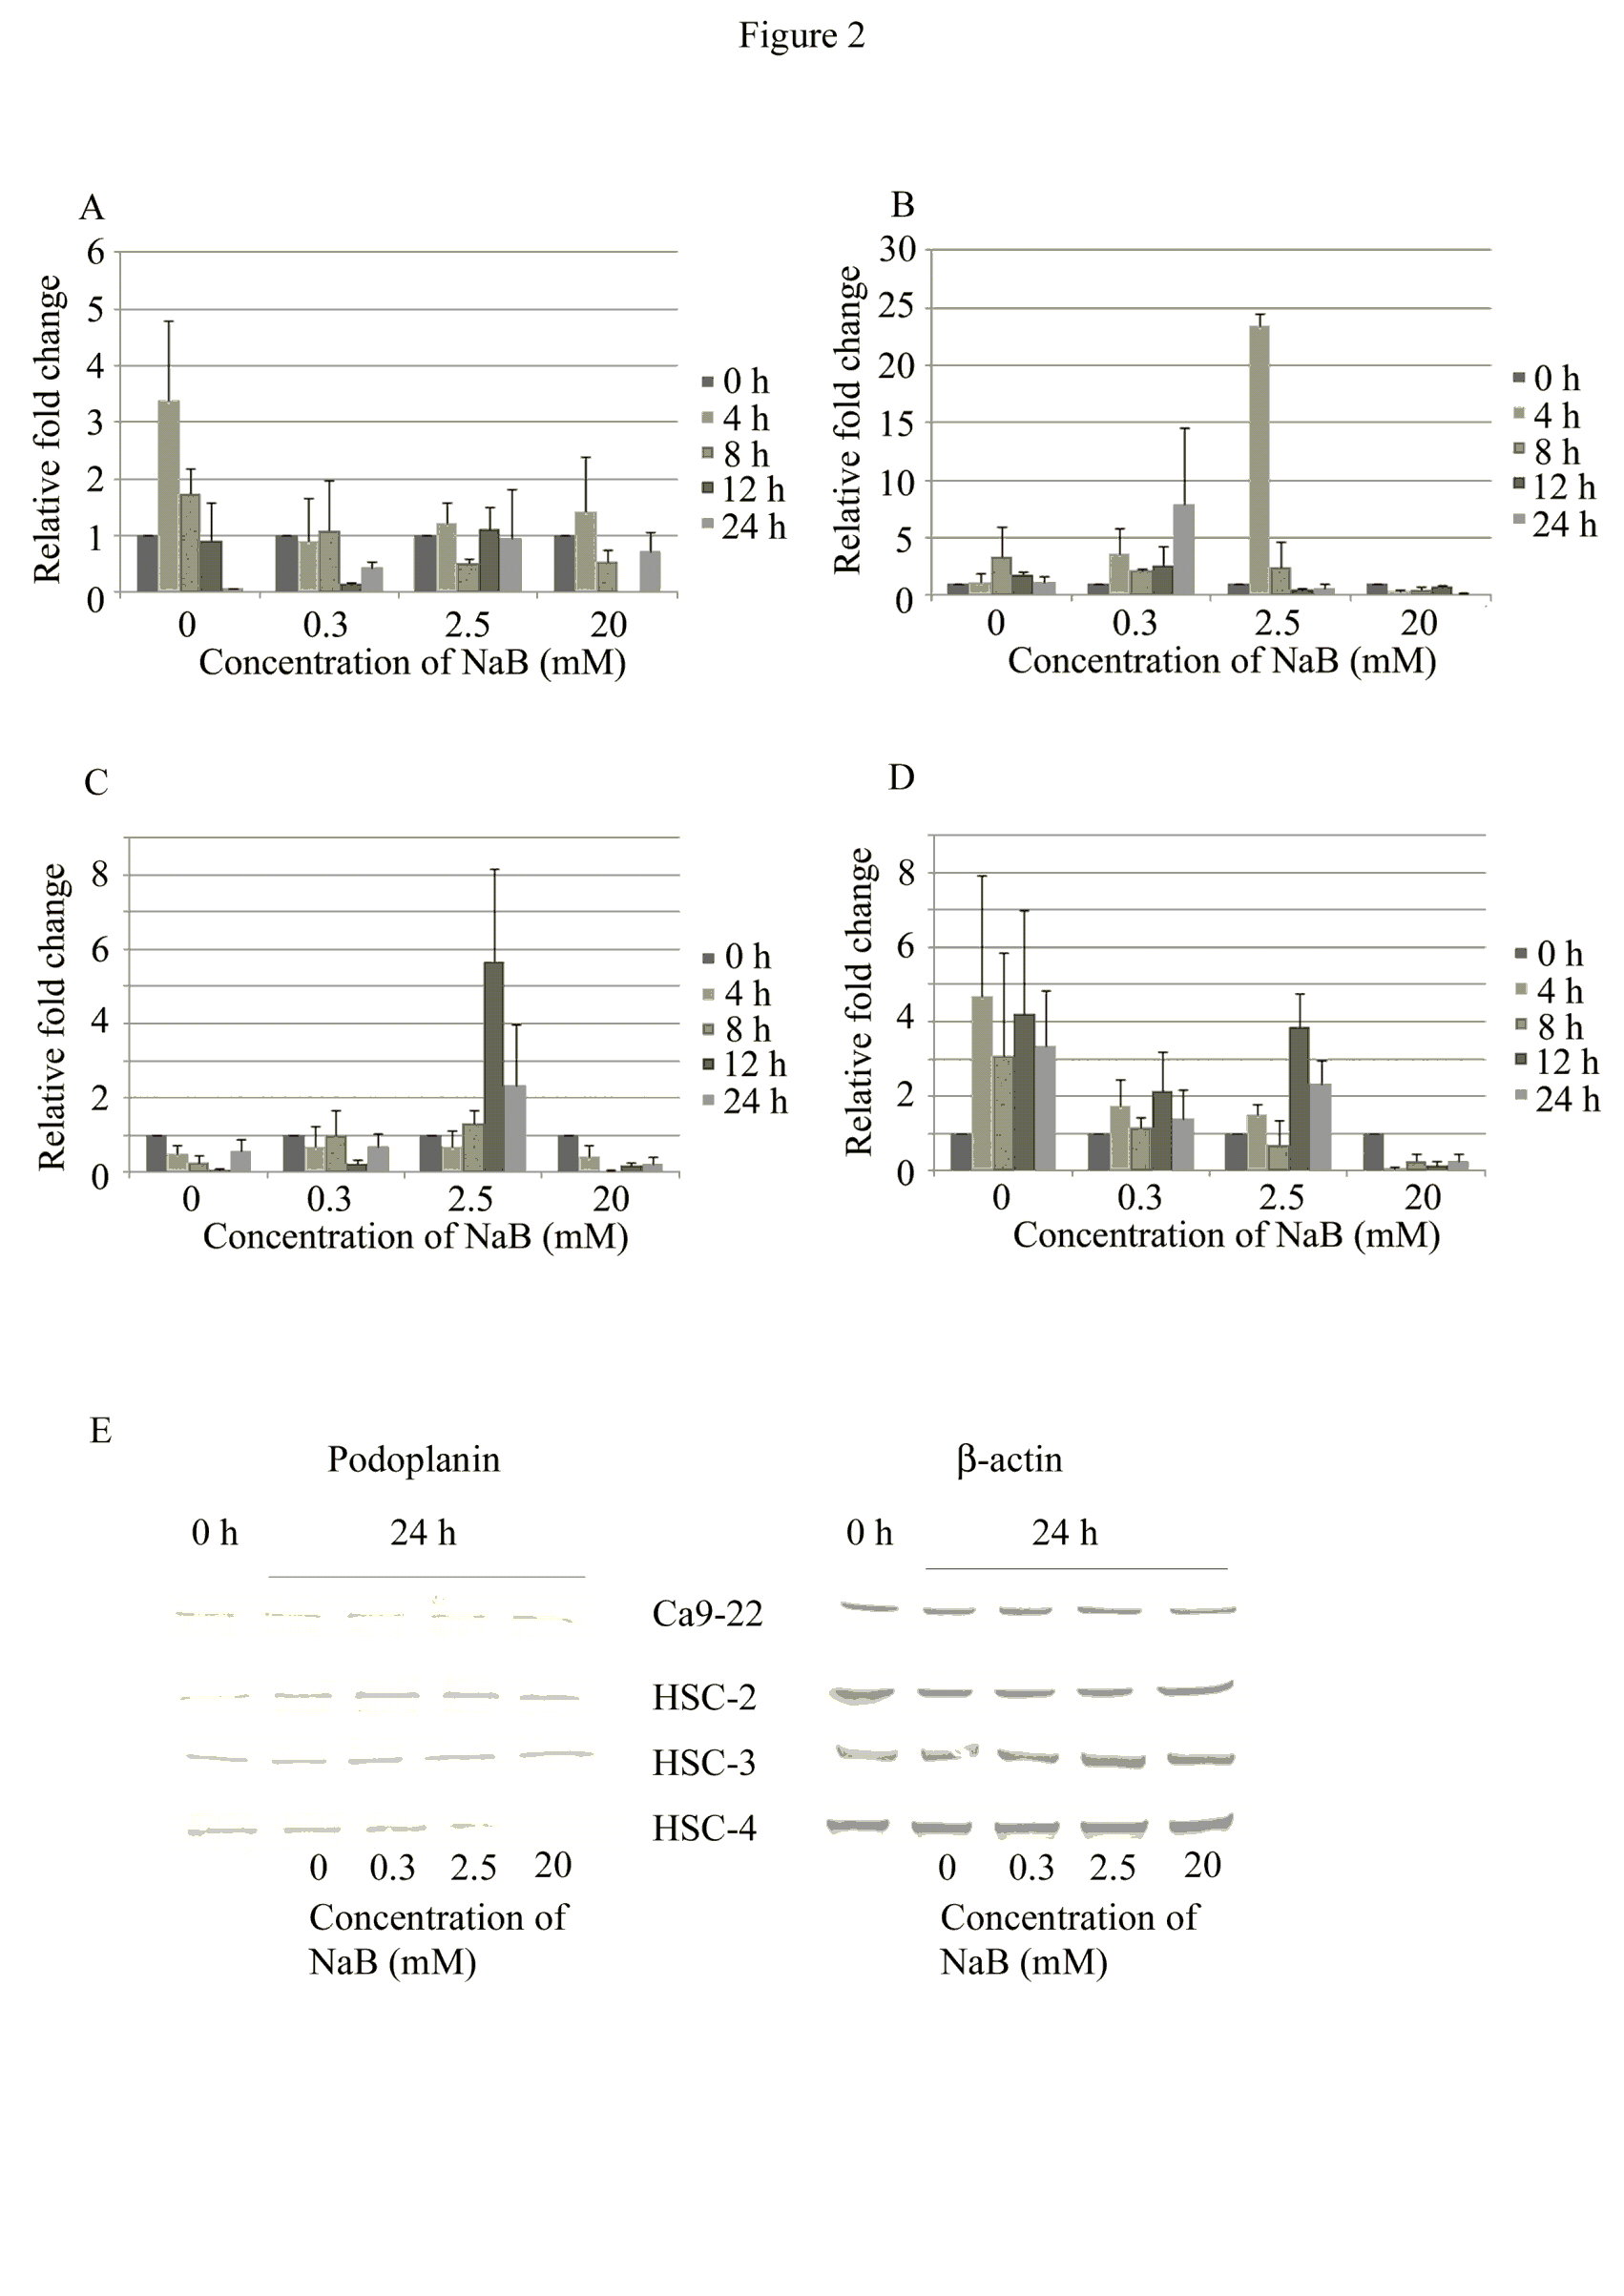
| Figure 2: Effect of NaB on the expression of podoplanin. Expression of podoplanin was detected by real-time RT-PCR. Expression levels were normalized to that of the control RNA (0 mM). Total RNAs were prepared from Ca9-22 (A), HSC-2 (B), -3 (C), and -4 (D) cells treated with 0, 0.3, 2.5, and 20 mM NaB for 4, 8, 12, and 24 h. Podoplanin and b-actin expression were studied by western blot analysis after incubation of each cell line with NaB for 24 h (E). Each bar represents the mean ± SD of three separate experiments in duplicate samples. |