 |
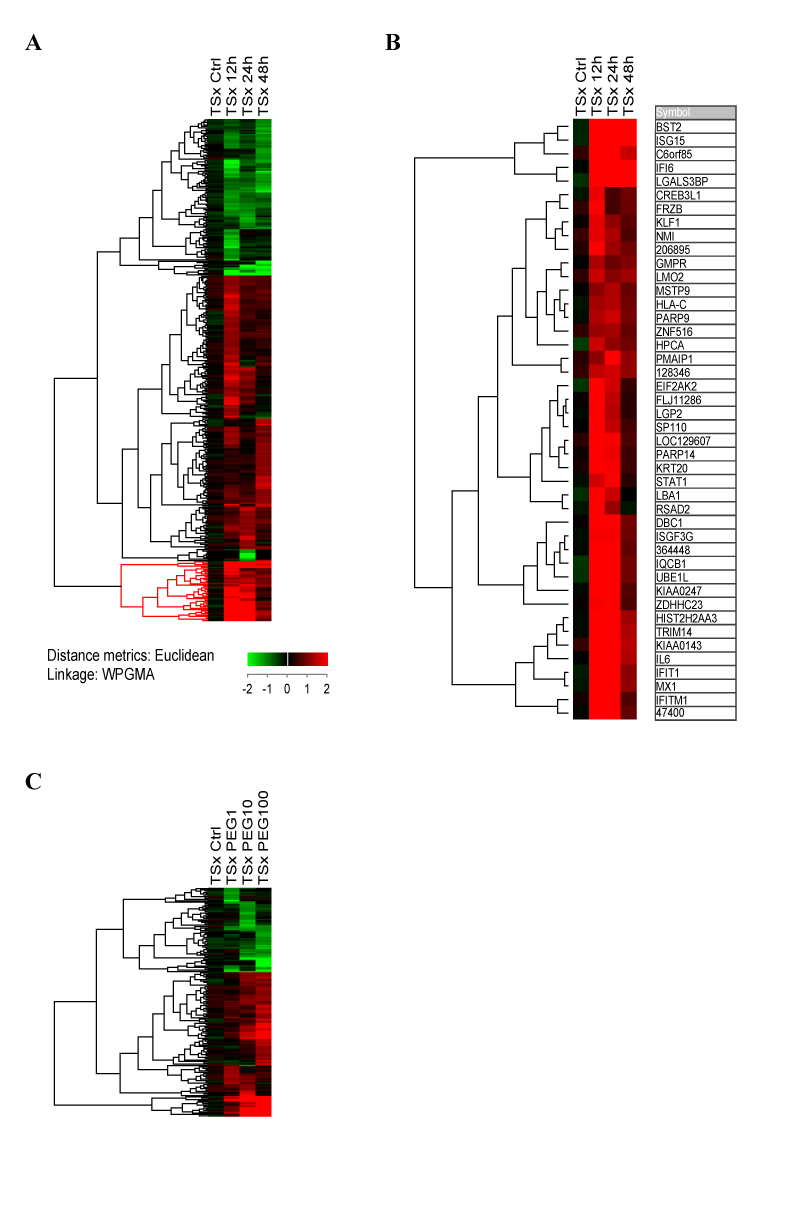
| Figure 3: Hierarchical clustering of gene expression patterns in initial time and dose response experiments. A. 369 differentially expressed probes in xenograft TSx treated with 100 μg/kg/week PEGylated IFN-a2b for 12, 24 and 48 hours. B. Expanded view of lower subcluster (red) from A, showing induction of numerous interferon-regulated genes C. 168 differentially expressed probes in xenograft TSx treated with 1, 10 or 100 μg/kg/week PEGylated IFN-a2b for 24 hours. An untreated control sample (TSx Ctrl) was also included. The signal of each probe is given as log2 of the ratio between the treated and untreated samples that was co-hybridized to the arrays, represented as mean value of two replicated assays. The probes presented in the clusters were at least 2 times up- or down-regulated in at least 1 of the treated samples in the cluster.” |