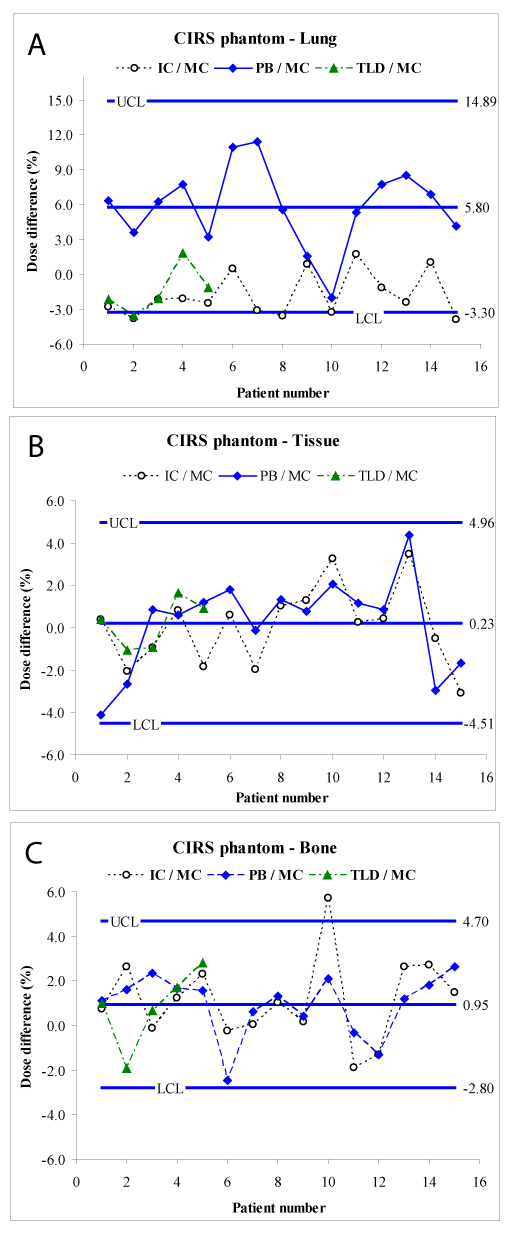
Figure 3: Percentage dose difference between MC calculations, IC measurements, and PB calculation for points located in: (a) lung, (b) tissue, and (c) bone. The upper and lower control limits are denoted by UCL, and LCL, respectively. The solid lines in the plots represent the center line, and upper and lower control limits for the PB/MC IMRT QA process.