 |
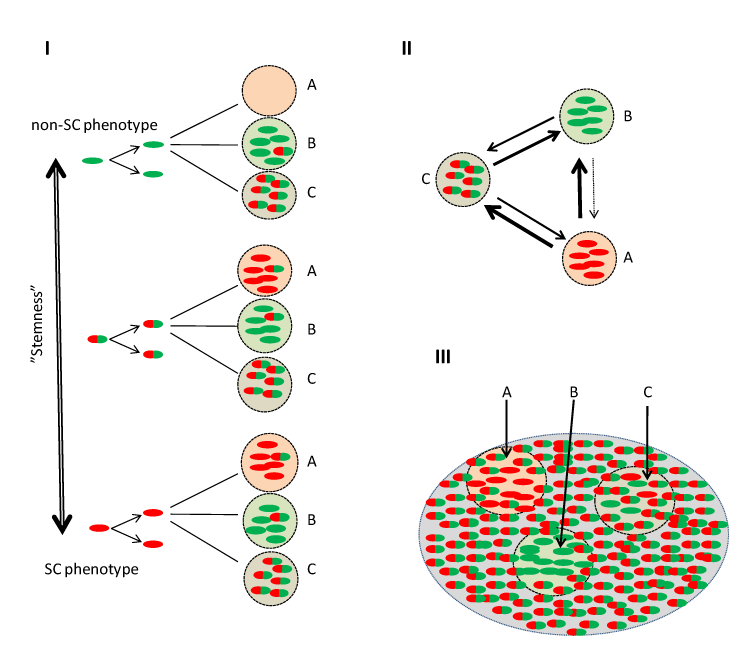
| Figure 2: The Stemness phenotype model. I) All cancer cells have stem cell potential and divide symmetrically. Clonal expansion of a single cancer cell generates, due to random biological variation cells having different phenotypes (“stemness”) ranging from a pure GSC phenotype (red oval) to a pure non-GSC phenotype (green oval) depending on the environment (e.g. A, B or C). Environment A represents an environment similar to stem cell media and B represents an environment similar to standard culture conditions. Environment C represents an intermediate condition. II) In this example, three different phenotypes (pure SC, red ovals; pure non-SC, green ovals and an intermediate phenotype, red-green ovals) are represented in different “niches”. All three phenotypes can potentially interconvert at variable degrees (arrows) into each phenotype when permissive changes in the microenvironment occur. III) In vivo, the percentage of each fraction depends on tumor microenvironments (A, B, C) that might promote specifi c phenotypes. |