 |
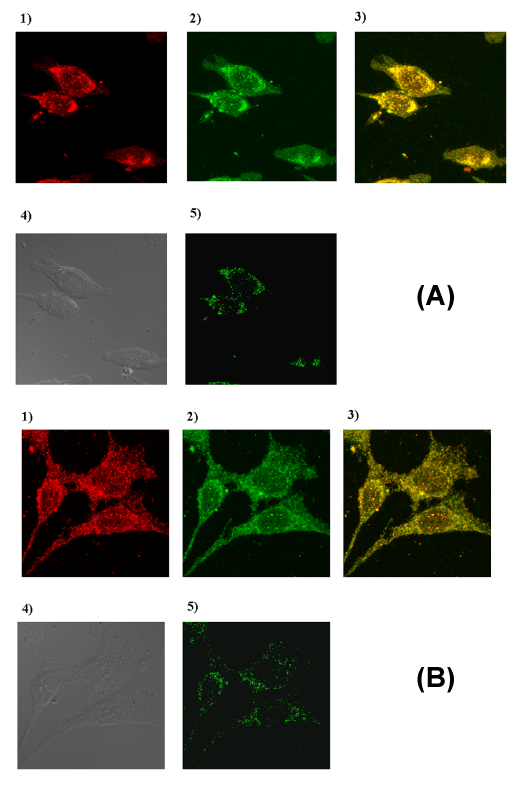
| Figure 3: MTA1 and PTEN colocalize with each other. a) MDA-MB-231 and b) MCF7 were fixed, permeabilized and incubated with antibodies against MTA1 and PTEN followed by incubation with fluorescently conjugated secondary antibodies. They were then subjected to confocal analysis. Images were acquired at 63X using the LSM 510 META laser scanning microscope from Carl Zeiss, Germany. Images were analyzed using the software LSM 510. 1) red signal indicates PTEN localization 2) green signal indicates MTA1 localization 3) yellow signal indicates colocalization 4) transmission image of cells 5) mask image. |