|
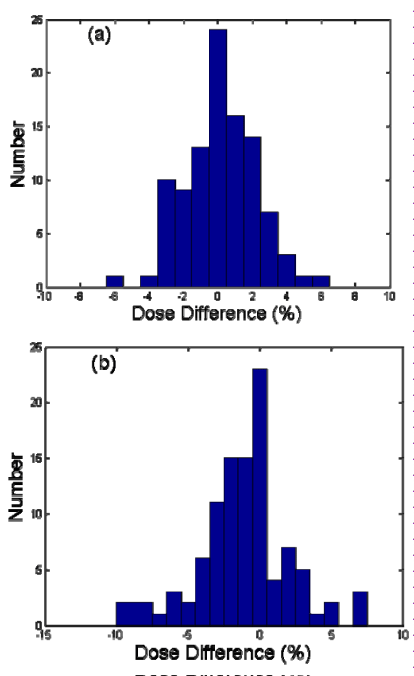
| Figure 2: Both plots show the independent dose calculation result from 100 helical tomotherapy patient plans with MU-Tomo. (a) Second check results without shifts (non-shift dose differences). (b) Dose difference consequences with systematic inter-fraction setup shifts. |