 |
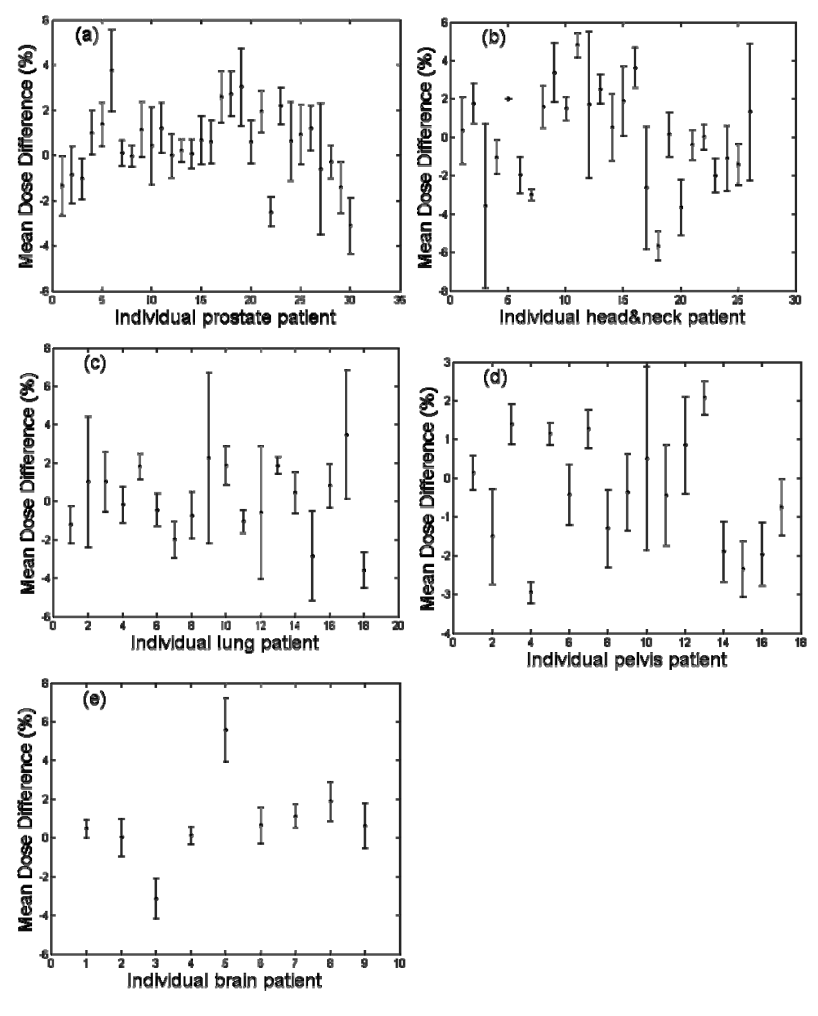
| Figure 3: Mean random variation of dosimetric consequences with standard deviations for each patient over its treatment fractions. Dose differences were calculated with MU-Tomo with random shifts. Dosimetric consequences are shown in the following plots for (a) prostate patients, (b) head & neck patients, (c) lung patients, (d) pelvis patients, and (e) brain patients. |