 |
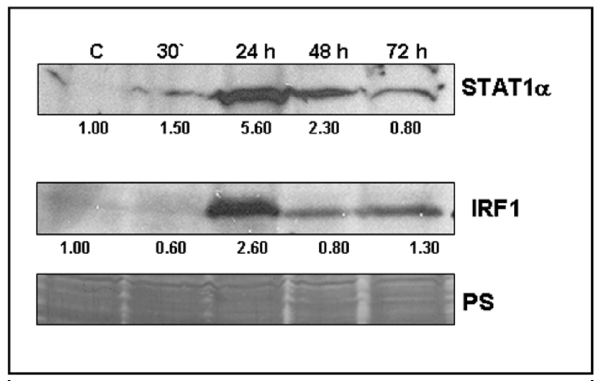
| Figure 2: Induction of STAT1α and IRF1 in IFNγ-treated WISH cells. Western blots for STAT1α (A) and IRF1 (B) from cells that were either not treated (control) or treated with 200 U of IFNγ for 30 min, 24 hrs, 48 hrs or 72 hrs. The densitometry values (indicated below respective lanes) for the samples in the representative blots were normalised with respect to the control. Standard error values for multiple independent experiments were ± 5% and ± 8% respectively. PS: Ponceau S stained gel representing equal loading. |