 |
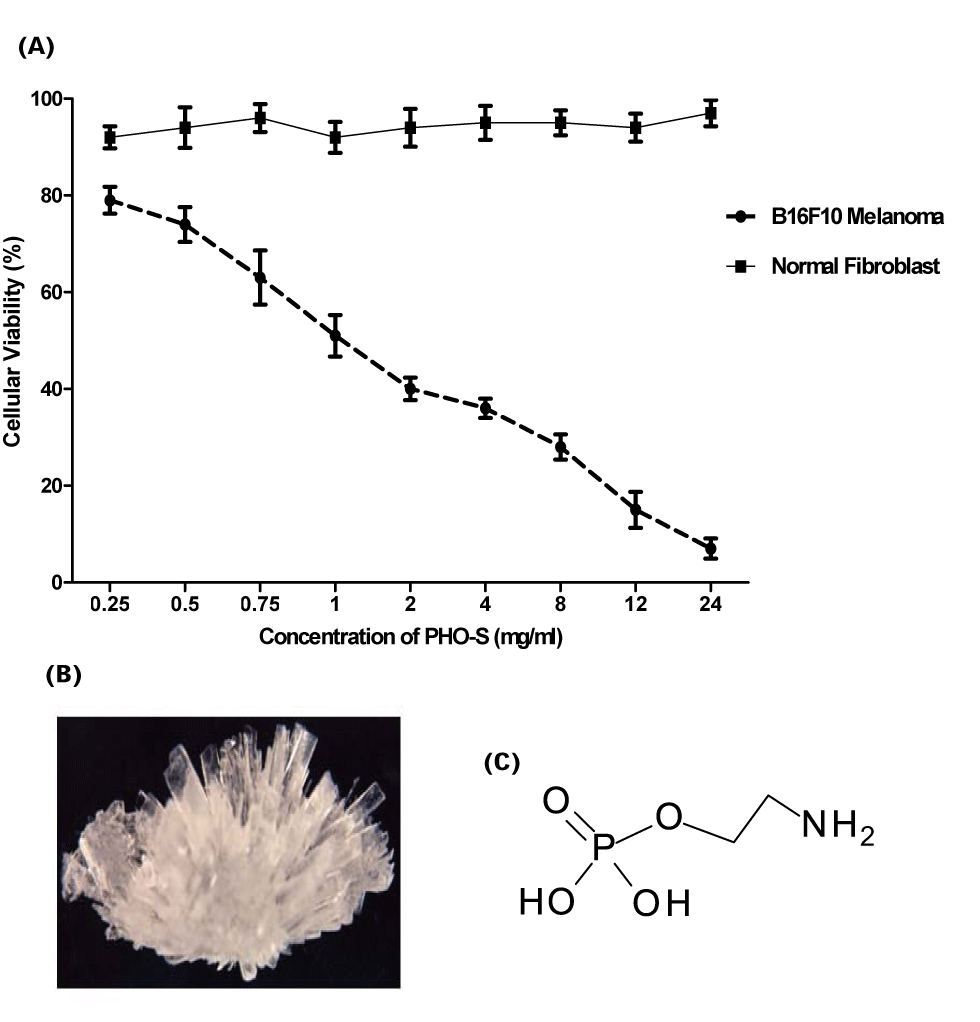
| Figure 1: Toxicity induced by PHO-S in B16F10 tumor and fibroblast cells evidenced by MTT colorimetric assay. The dose effect curve shows concentration- dependent toxicity in B16F10 cells treated with PHO-S (IC50% 1.4mg/ml), PHO-S did not affect normal fibroblasts. Values depict the mean an average (±SD) of eight plate’s measurements. Results are representative of three independent experiments (A). Crystal and structure molecular of PHO-S (B and C). |