 |
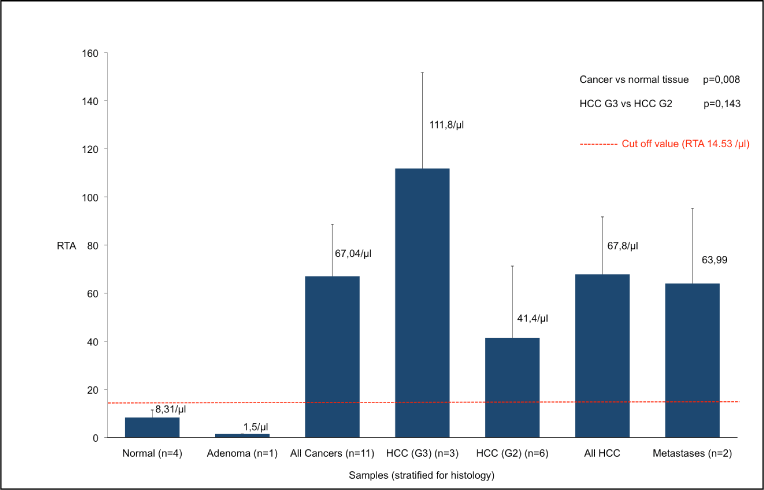
| Figure 4: Relative telomerase activity per µg protein (RTA) was measured with the tRQ-TRAP and displayed as means ± SEM (error bars) for each sample. The data show elevated telomerase activity in hepatocellular carcinoma (G2 and G3 HCC) and liver metastases in comparison to normal liver samples and a benign liver lesion (sample 29 I, liver adenoma). The difference in telomerase activity between cancer samples (median RTA 78.92, n = 10) and normal liver samples (median RTA 8.03, n = 4) was significant (Mann-Whitney U test, P = 0.008). The depicted line displays the cut-off value for relevant RTA-levels (above mean RTA + 2 SEM of normal liver samples). |