 |
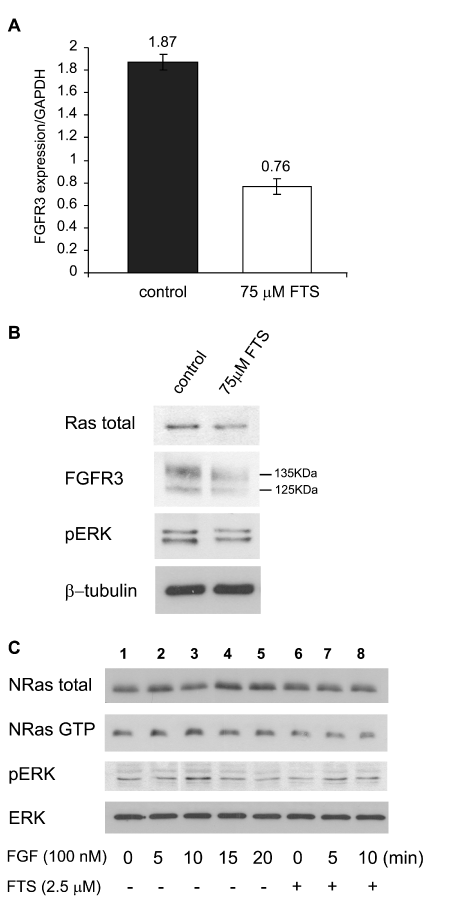
| Figure 2: FTS reduces FGFR3 and active ERK in NCIH929 cells. Cells (1 × 10⁶ cells/ml) were grown in 5% medium for 72 h in the absence or in the presence of 75 µM FTS (A,B). (A) Cells were harvested and prepared for RT-PCR, as described previously [35]. Samples were quantitatively analyzed for FGFR3 mRNA relative to the housekeeping gene GAPDH (means ± SD, n = 3 for control and FTS). (B) Cell lysates were subjected to SDS-PAGE and immunoblotting with anti-Ras, anti-FGFR3, anti-pERK and anti-ß-tubulin Abs. Typical immunoblots visualized by ECL are shown. FTS reduced FGFR3 by 36 ± 5% (mean ± SD, n = 3). FGF stimulation increased the amounts of active NRas and pERK in NCIH929 cells and was inhibited by FTS. (C) Cells (2 106 cells/ml) were plated, starved of serum for 48 h, and then stimulated with FGF (100 nM) every 5 min for 20 min in the absence and in the presence of 2.5 µM FTS (added 24 h after the beginning of starvation). The cells were then lysed. Ras activity was determined by a GTP-Ras pull-down assay followed by western blotting with anti-NRas antibody. NRas, pERK, and ERK were quantitatively analyzed by western blotting. Typical immunoblots visualized by ECL are shown (n = 3). The difference between the baseline pERK (Figure 2C, lane 1) and FGF-stimulated pERK (Figure 2C lane 3, P < 0.05 n = 3) and between this value and the FTS inhibition of the FGF-stimulated pERK (Figure 2C lane 8, P < 0.05 n = 3) were significant. |