|
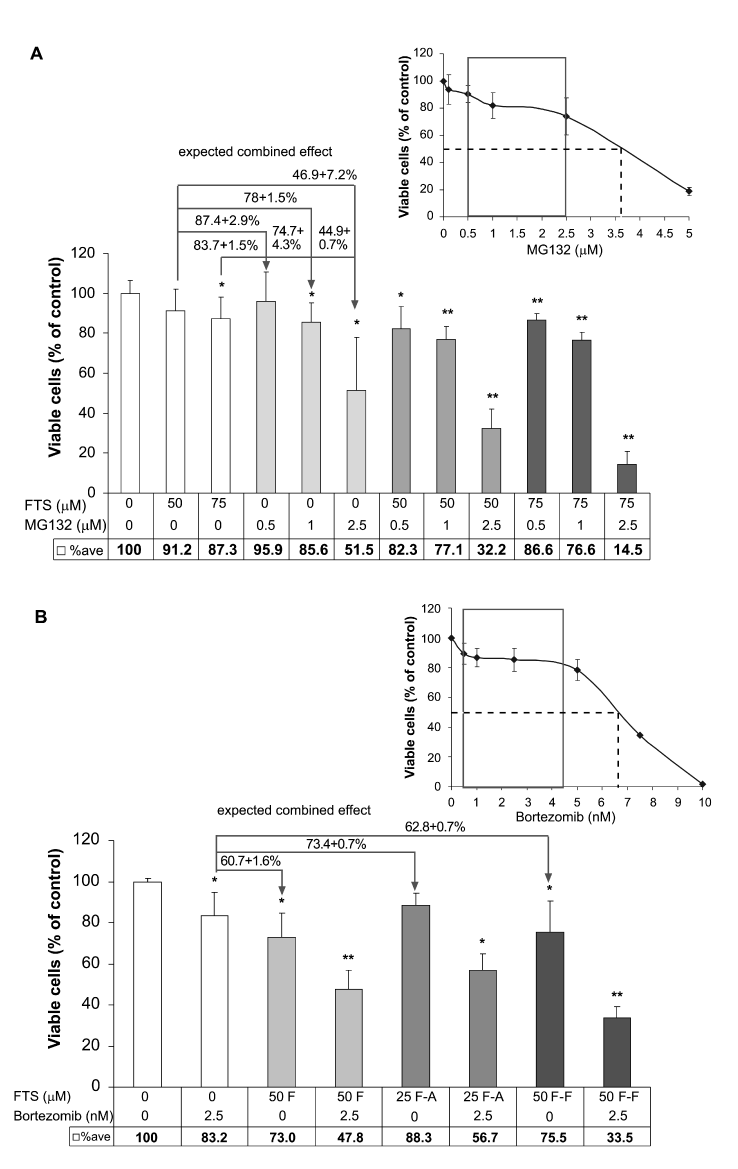
| Figure 3: Effects of FTS combined with proteasome inhibitors on NCIH929 cell growth. (A) NCIH929 cells (1.5 × 10⁶ cells in 24-well plates) were plated in 5% FCS medium and treated with 0.1% DMSO (control) or the indicated concentration of MG132 for 30 min. They were then washed and treated with FTS (50 or 75 µM) or the vehicle (0.1% DMSO) for a further 3 days and then counted (at 530ex/590em) with the aid of the alamarBlue reagent. Inset: Shown are the numbers of cells in MG132-treated samples, calculated as a percentage of the total number of cells in the control (means ± SD, n = 3). Highlighted blocks in the box record the concentrations at which the effect of MG132 alone was moderate; the IC50 is also marked. (B) NCIH929 cells (0.5 × 10⁶ in 24-well plates) were plated in 5% FCS medium and treated with 0.1% DMSO (control) or with the indicated concentration of FTS or FTS-derivatives (F, FTS; F-A, FTS-amide; F-F, 5-fluoro-FTS) in combination with bortezomib (2.5 nM) for a further 3 days and counted (at 530ex/590em) with the aid of the alamarBlue reagent. Inset: Shown are the numbers of cells in bortezomib-treated samples, calculated as a percentage of the total number of cells in the control (means ± SD, n = 3). Highlighted blocks in the box record the concentrations at which the effect of bortezomib alone was moderate, the IC50 is also marked. Numbers of cells in the drugtreated cultures are expressed as percentages of the numbers recorded in the zero-drug (vehicle-treated) controls. Data are means of three experiments. *P < 0.05, **P < 0.001, Mann-Whitney U test. |