 |
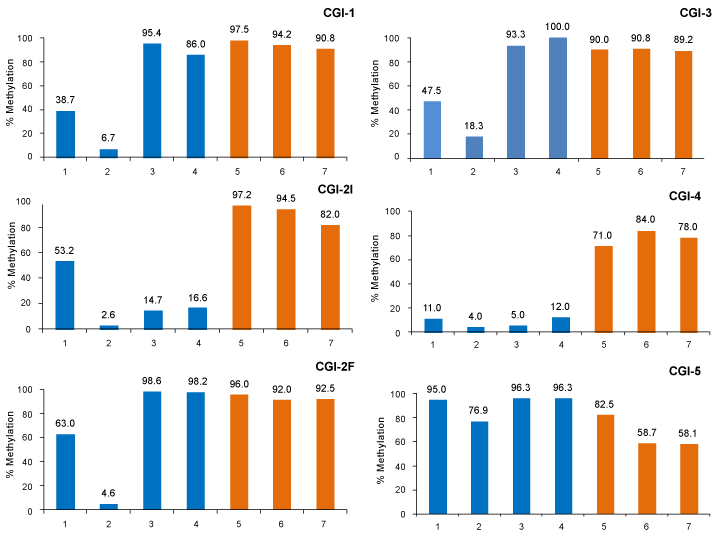
| Figure 3: Global Methylation % of CGIs, 1, 2I, 2F, 3, 4 and 5 from CXCL12 gene in breast cancer cell lines. Each graphic represents each CGI (1, 2I, 2F, 3, 4 and 5). The percentage of methylation from each breast cancer cell line are represented by bars numbered, 1 (HB4a), 2 (HB4aC3.6), 3 (MCF7), 4 (PMC42), 5 (MDA-MB-436), 6 (MDA-MB 435) and 7 (MDA-MB-231). The bars in blue represent positive and red negative expression of CXCL12 respectively. The sequencing data for CGI 4 was obtained for Ramos et al. [7]. |