 |
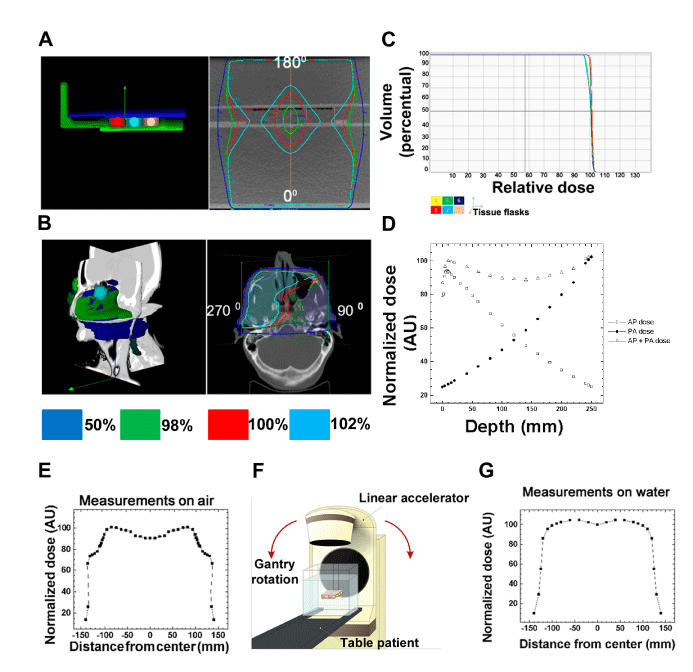
| Figure 1: Irradiation planning and X-rays measurements. A. Radiotherapy planning to A431 cells in tissue flasks based on computer tomography images. Right panel shows isodoses curves for vertical parallel opposed fields, as well as the percentage of doses absorbed by the A431 cells. B. Radiotherapy planning of SCC maxillary sinus. Isodoses curves for lateral parallel opposed fields and the percentage of absorbed doses are represented. C. Dose-volume histograms calculated by CAT3D for win.32. D. Real dosimetry measurements for the in vitro irradiation model using ionization chamber. The depth doses curves for parallel opposed fields was measured and normalized to isocenter. E. Dose profile of conventional in vitro irradiation model measured by ionization chamber in air. Data show non-uniformity dose along the field profile. F. Schematic diagram for the in vitro irradiation model using a 4MV linear accelerator and acrylic platform positioned inside phantom filled with water. G. Dose profile of the proposed in vitro irradiation model measured by ionization chamber immersed in water phantom. Data demonstrate uniformity dose distribution along the irradiation field. |